How to Interpret My AIM Dashboard

Contents
Realbase’s advanced automation is exclusively designed for real estate marketing. Our AIM Digital Dashboard shows you the campaign performance in real time, so you always have the latest results.
We believe it’s equally important you understand the results of your digital marketing easily (whether it be for yourself or your vendors).
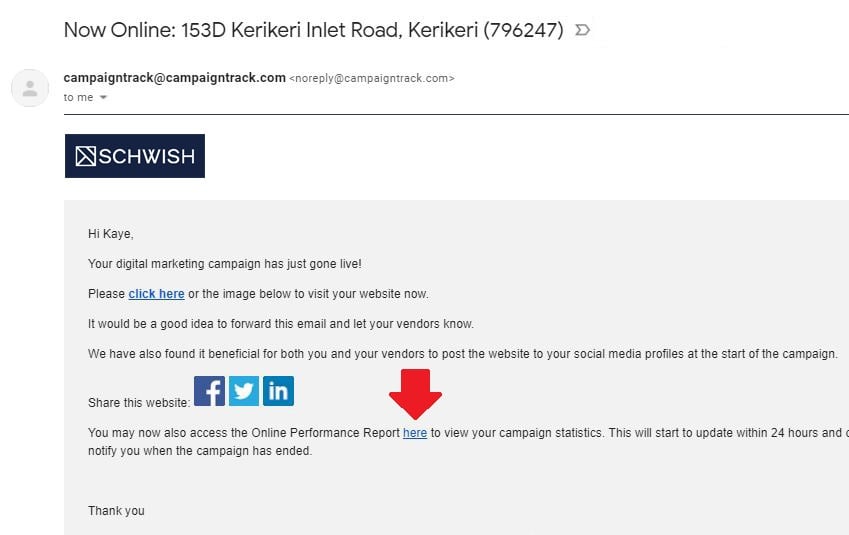
Once your AIM Digital campaign goes live, an email will automatically be sent to you containing the link to view your AIM Dashboard.
Here’s a quick refresher guide on how to interpret your AIM Dashboard.
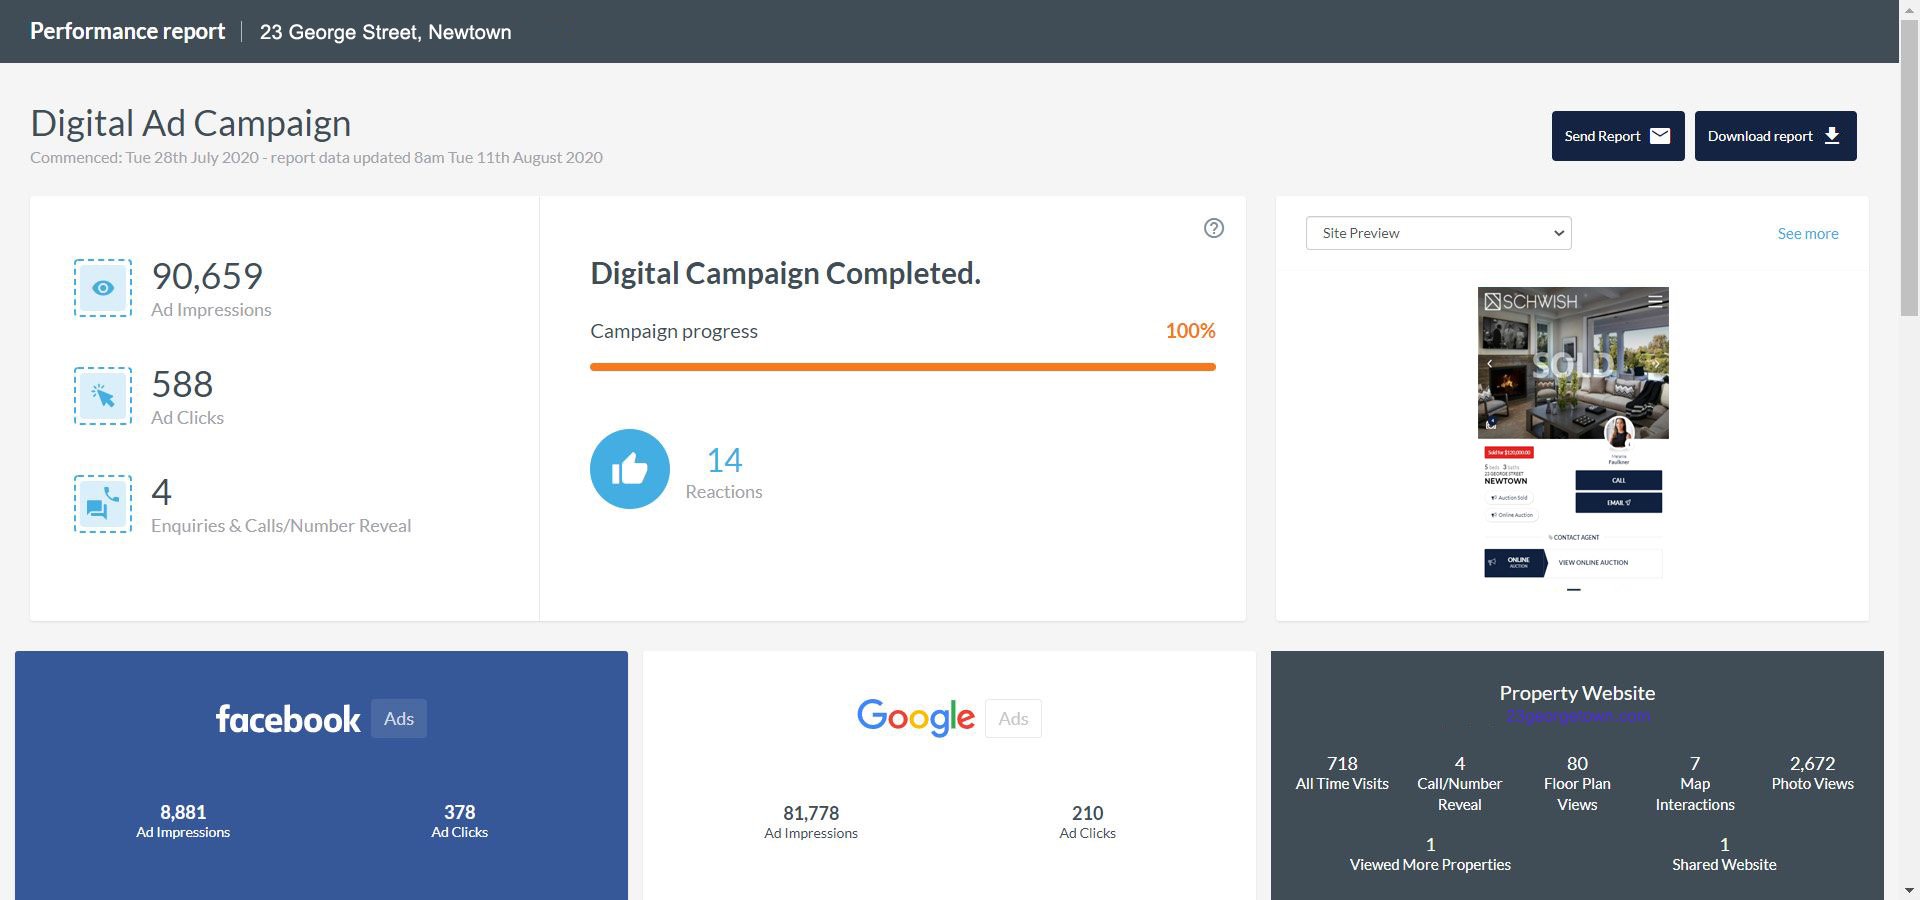
Ad Impressions — The total number of times your ad is seen. Each time your ad is viewed on an online platform, it’s counted as one impression.
Ad Clicks — The total number of times your ads have been clicked on.
Enquiries & Calls / Number Reveals
- Enquiries — When someone successfully submits a form enquiry on your Unique Property Website (UPW), it will be counted as one enquiry.
- Calls / Number Reveals — The amount of times someone clicks on the phone number to reveal the full number. Some people will write the number down, others will make a direct call. Because of this, we safely record this as a Call/Number Reveal, as opposed to a successful enquiry.
Campaign Progress — The campaign progress bar shows how far along the campaign has progressed in terms of media spend and campaign date length. Each digital package has different durations and media spend, so this bar will differ between packages.
Reactions — The number of social reactions (eg: ‘Likes’) on your ads. This is recorded through our automated social posts (if enabled).
Site Preview
- Site Preview — Mobile preview of the property website used as the landing page for the campaign.
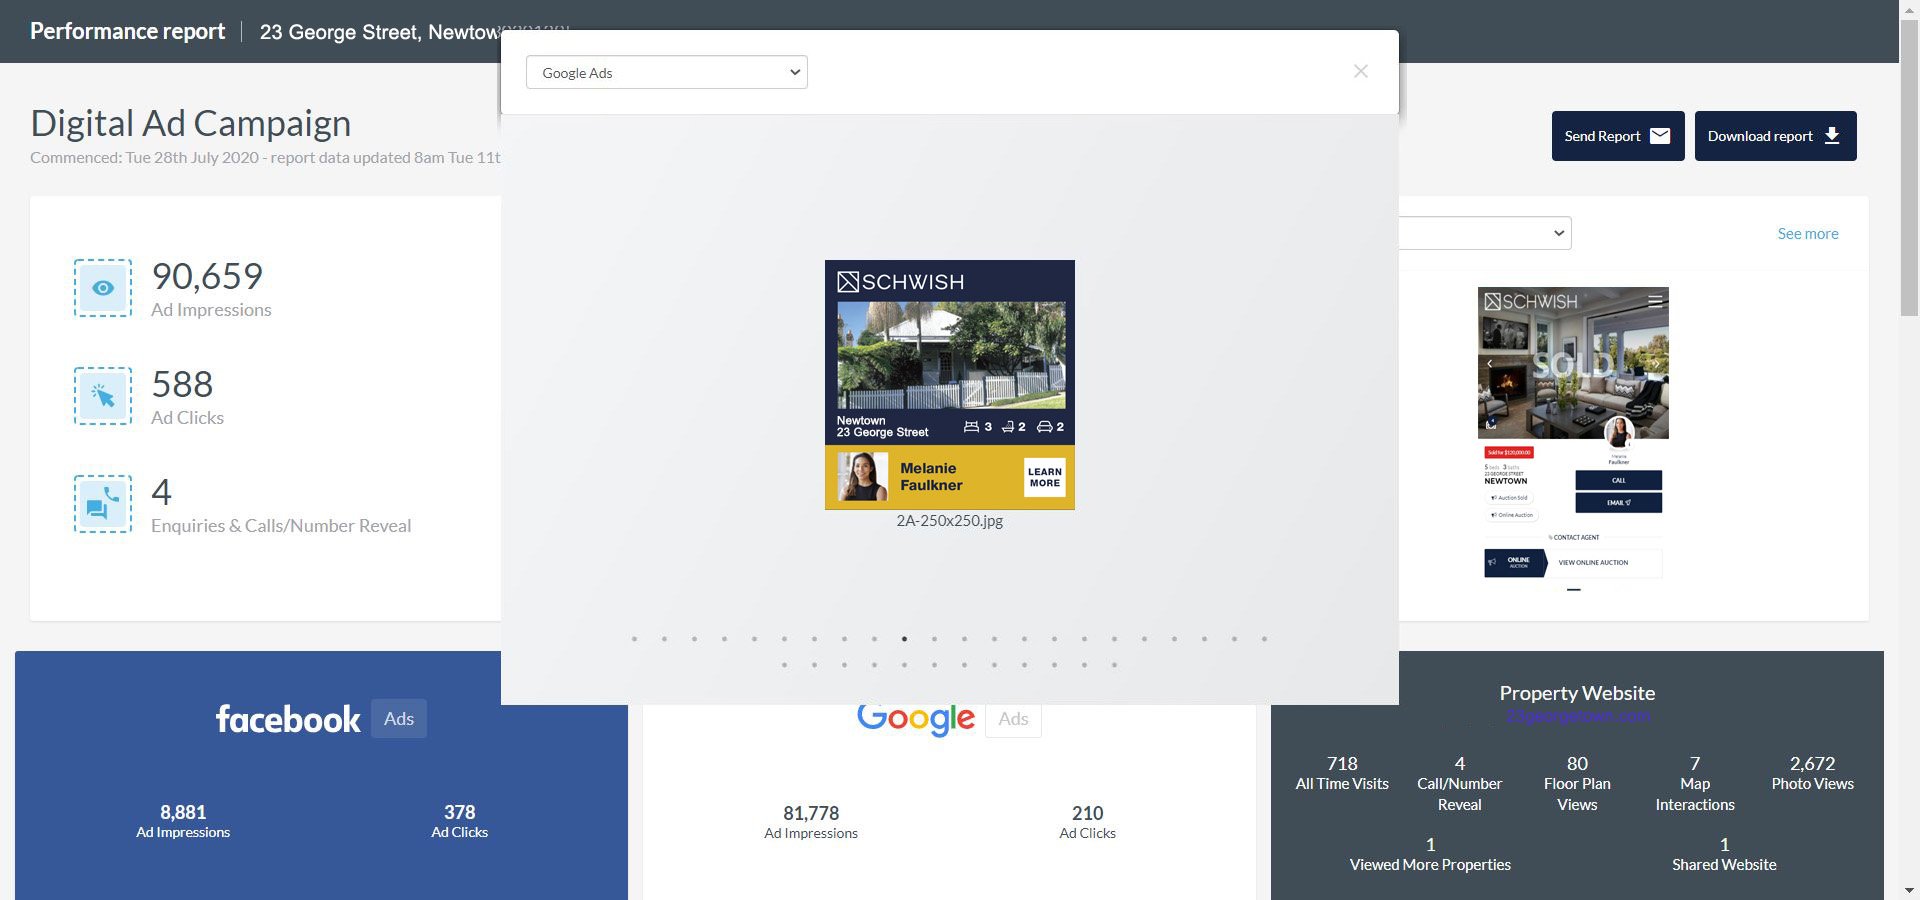
- Google Ads — The ads used for the Google campaign. Click see more to view all the different ad sets and sizes.
- Facebook Ads — The ads used for the Facebook campaign. Click see more to view all the different ad sets.
Facebook Ads Data — Ad Impressions and Ad Clicks from your Facebook campaign. (Definitions outlined above)
Google Ads Data — Ad Impressions and Ad Clicks from your Google campaign. (Definitions outlined above)
Property Website Data — A mini-breakdown of actions taking place on your UPW. The data is collected from different interactive areas of the property website.
Social Media Buzz — Social Media Buzz is pulled from comments likes on your ads and your posts if connected. You can comment on your ads from here by clicking on the message as it takes you directly to the message to respond.
Age — The percentage of interaction to your property website according to age ranges.
Gender — The percentage of interaction to your property website according to gender.
Devices — The percentage of interaction to your property website according to device (mobile, tablet and desktop).
Location — The percentage of interaction to your property website according to top countries and top cities.
To share your AIM Dashboard, just click “Send Report” on the upper right corner of the screen and fill out the mandatory fields.
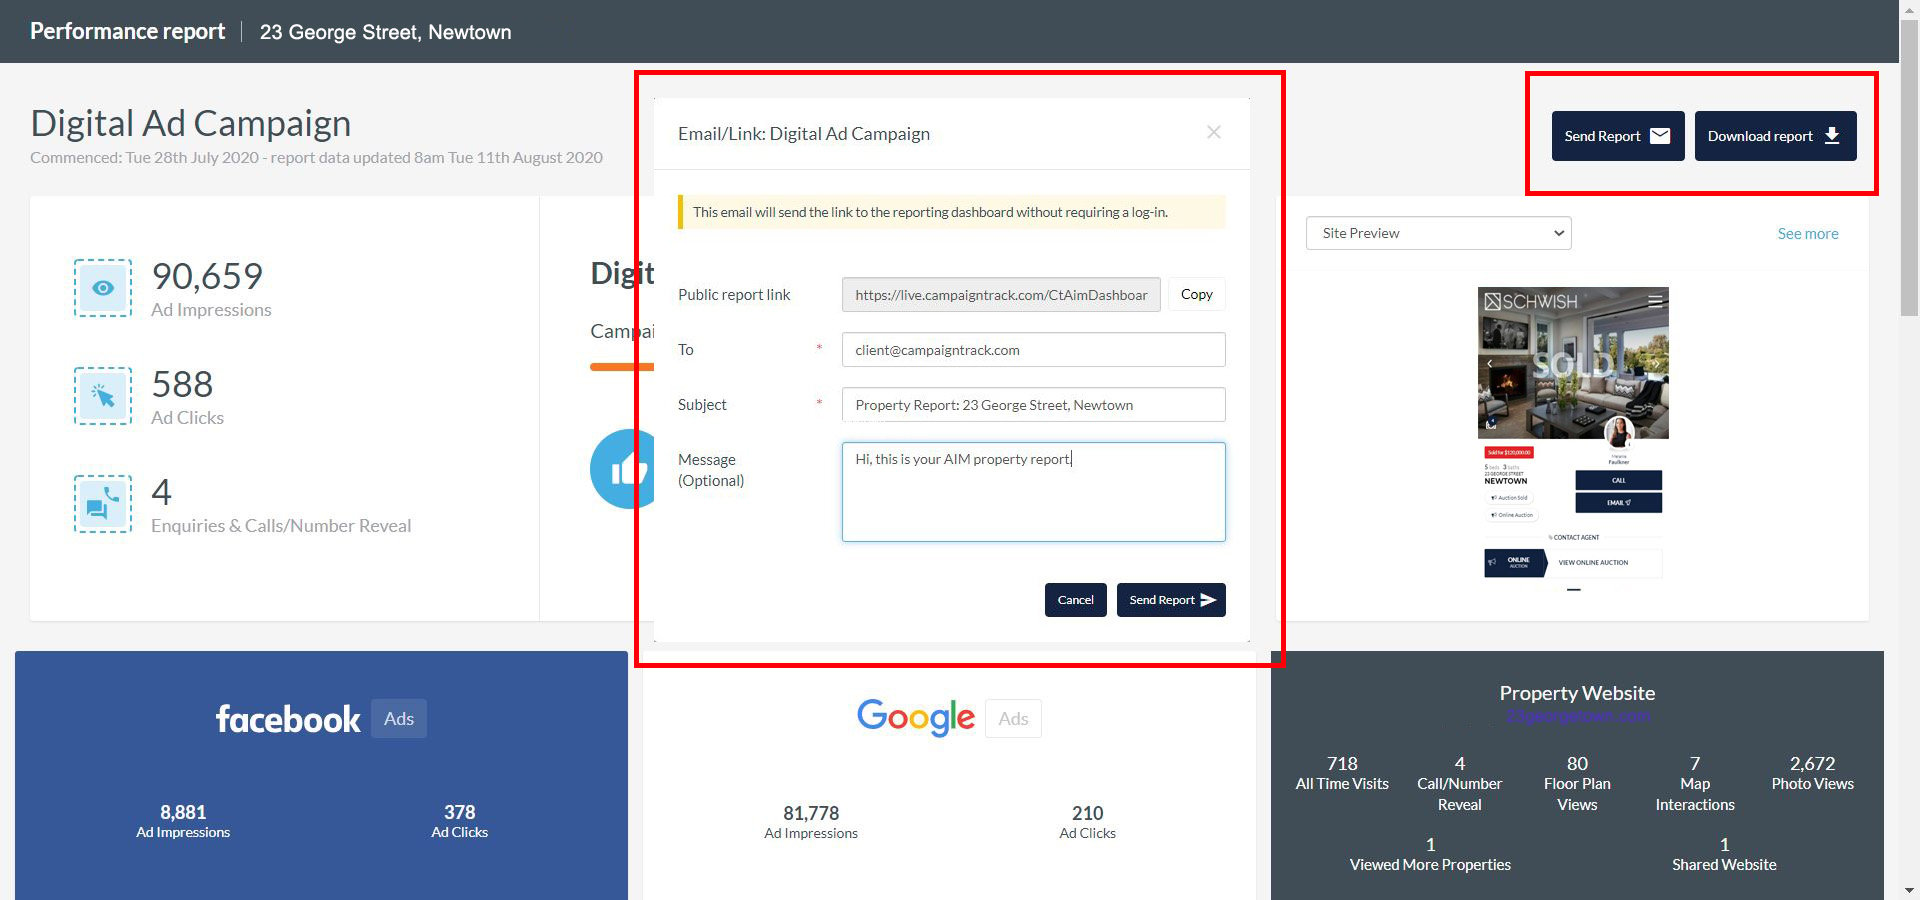
Note: The download option is only available if you’re logged in your Campaigntrack account. This also gives you the option to print your AIM dashboard in your branding.
Your AIM Dashboard will automatically update itself twice a day. And a little tip from us – it’s great to use these stats in appraisal for the next vendor! Happy marketing!
Get in touch with us to find out how AIM Digital could improve your digital marketing strategy.
Keep up with the latest trends
Keep an eye out for other articles on digital marketing, it's fascinating stuff! To browse previous articles, click here.